Saturday, September 25, 2010

Focus and Leverage Part 13

In my last blog I introduced the basics of Drum-Buffer-Rope (DBR) including how holes in the three buffer zones can form the basis for your improvement efforts. That is, if the holes are always occurring at the same location for the same reason, then improvement efforts should be focused there. Today, I want to get into more of the details of how DBR works, how to calculate buffer times and some of the positive implications of a successful DBR implementation.


In DBR, the drum is the constraining resource and the pace of the drum sets both the priority and work schedule for your process. The buffer is the time placed in front of both the constraint and shipping to protect the due dates for both. Our ability to meet these two due dates is dependent upon two things:

1. We must make certain that the buffer is large enough to accommodate all of the uncertainties (Murphy) that rear their ugly head and chew away at our buffer so that our schedule is achieved.

2. We must make certain that the release of raw materials is done on time to guarantee that the constraint is never starved and that the shipment date is never compromised.

The rope is the length of time needed to complete the processes that are in front of the drum. It is the signal sent to the beginning of the process to release raw materials on time. So let’s talk about how we calculate these buffers.

Although this may sound overly simplistic, proper buffer sizing only occurs by monitoring it. By that I mean if parts are always arriving in the green and yellow zones, then the buffer is most likely too big. Conversely, if the parts are always in the yellow and red zones, then the buffer is most likely too small. Goldratt has suggested that an initial buffer size can be calculated by taking one-half of the current lead time and dividing that time between the constraint buffer and the shipping buffer. This initial buffer size can then be adjusted up or down depending upon when the parts are arriving. Another way of saying this is, if you are always in the expediting mode, then your buffer is too small. If you are never expediting, then your buffer can be reduced. This attention to buffers is referred to as buffer management.

Each open work order or production batch will have a buffer status that we can calculate. For example, based upon the buffer status we can relate the color code to a percentage of buffer consumed as follows:

1. Green Orders: If the buffer status is greater than 67%, then there is still plenty of time to complete it so no expediting is ever required.

2. Yellow Orders: If the buffer status is between 33 and 67%, then disruptions have occurred and there is a risk that any additional disruptions might cause the order to be late, but there is still ample time so no expediting is needed. However, it will be important to track this order more closely than normal.

3. Red Orders: If the buffer status is less than 33%, then any further disruption will definitely result in a late order. Therefore, close scrutiny of this order is required and the probability of the need for expediting is very high.

It is important to understand that buffer status changes with time and as time moves forward, the buffer status may change. I recommend, at a minimum, that buffer status be checked at least once per shift and that a quasi FIFO priority system be used with red orders being first, followed by yellow orders and then green orders.

Using color codes offers another advantage in that if records are kept as to why orders consistently fall into a yellow or red zone, then an opportunity for improvement exists. If a repeating root cause exists, then solving that problem will provide the opportunity to reduce the overall lead time which translates into a competitive advantage for your company.


Figure 1

The three main elements of DBR are:

1. A shipping schedule which is based upon the rate that the constraint can produce orders (i.e. Throughput)

2. A constraint schedule which is tied to the shipping schedule.

3. A material release schedule which is tied to the constraint schedule.

Visually these three elements might look like the Figure 1 displaying the three elements and the interconnectedness of each. You will notice that in addition to the constraint and shipping buffer, there is a third buffer, the assembly buffer. I included this in the event that your process involves an assembly that requires the constraint part before it is completed. That must be accounted for as well if part of your process includes assembly.

In my next blog we will complete our discussion of Drum-Buffer-Rope and move on to the next step in the Ultimate Improvement Cycle.

Monday, September 20, 2010

Focus and Leverage Part 12

In my last posting, we discussed the development of a Constraint Improvement Plan and I gave you an example of such a plan. In Steps 2a and 3a of the UIC, you are reducing waste and variation primarily in the constraint by executing your plan. Our focus thus far has been on the constraint, but now it’s time to turn our attention to non-constraints. You will recall that the third of Goldratt’s five focusing steps is, subordinate everything else to the constraint. Just exactly what is a non-constraint? In TOC jargon, a constraint is any resource whose capacity is less than the demand placed on it and a non-constraint is any operation whose capacity is greater than the demand that is placed on it. So theoretically, constraints limit throughput while non-constraints do not, but as you will see, the reality is that this is not always true. So why did Goldratt believe that it was so important to subordinate everything else to the constraint? To quote Debra Smith1, “The ability to subordinate will define a company’s ability to succeed with the Theory of Constraints. Exploitation of the constraint is dependent upon effective subordination.”

The key role of non-constraints is to guarantee that the constraint always has work exactly when it is needed so as never to allow starvation of the constraint. Constraint starvation translates directly into lost throughput which negatively impacts profitability. The most effective method I have found to assure that constraint starvation does not occur is by using a TOC based scheduling system called Drum-Buffer-Rope (DBR). DBR is designed to regulate the flow of product through a production line based upon the processing rate of the most constrained resource, the capacity constrained resource (CCR). In a DBR system, the production rate of the CCR is equated to the rhythm of a drum. To protect the drum (CCR) from starvation, a time buffer is placed in front of it which is the average amount of time required for raw materials to be released into the process and processed by the up-stream non-constraints in time to reach the CCR. In order to guarantee that product reaches the drum on time, a signaling mechanism, referred to as a rope, connects the drum (CCR) to the raw material release for the first operation. Therefore, the first purpose of the rope is to ensure that the CCR is never starved. By the same token, we want to guard against excess WIP entering the system and the rope prevents this as well. Incidentally, the derivation of the term DBR is found in Goldratt’s book, The Goal, so if you haven’t ever read it, I strongly encourage you to do so. Because of the importance of DBR, the next couple of postings will focus on the implementation of DBR.

The first step in any kind of TOC based implementation is to correctly identify the constraint, or more specifically, the Capacity Constrained Resource (CCR). The slowest resource in any production operation is the CCR which sets the pace for every other part of the process. Any other resource that out-paces the rate of the CCR only serves to increase Operating Expense (OE) and Inventory (I) if it is permitted to run at maximum efficiency. In fact, maximizing production at non-constraints will always result in large levels of WIP, long cycle times, more labor than is required, increased demands for storage, and a larger than required investment in raw materials which ties up cash. The objective here is to provide exceptional due-date performance while minimizing inventory and DBR offers the solution to this conundrum.

The basic premise for scheduling and production management is that different resources have different capacities and because statistical fluctuations and unplanned disruptions exist and can never be truly eliminated, any solution must take this fact into account. The reality is that the CCR must be protected from “Murphy” who enters all processes in the form of random statistical fluctuations and interdependencies. Interdependencies means that a resource must wait for another resource to finish before it can start to work. DBR uses three strategically placed buffers to guard against these two forms of Murphy as follows:

1. A buffer in front of the CCR to prevent starvation of the CCR if Murphy strike any resource in front of the CCR

2. A buffer in front of assembly if a CCR part is required to complete the assembly

3. A buffer in front of shipping to assure on-time delivery in the event that Murphy strikes upstream of shipping

It is important to understand that these three buffers are in the form of time rather than products, and that the management of these buffers is critical to your success using DBR. So the question becomes, if time is the buffer, then how do you know how much time is required? Before I answer that question, I want you to form a visual image of what buffer management might look like in a typical production environment.


Figure 1

Figure 1 is meant to depict any of the three buffers just presented. Remember, these buffers are time based rather than physical product. Monitoring the buffer is intended to send a signal to all concerned as to when to expedite and when not to expedite. When the part does not enter the buffer on schedule, it creates what is known as a “hole” in the buffer. The figure indicates that there are three zones, a safe zone (green), a caution zone (yellow) and an expedite zone (red) for each of the three buffer types. Each of these three zones represents 1/3 of the total calculated time in which the product must be available at that buffer location. If a hole is formed in the green zone, there is no cause for concern, while holes in the yellow zone translate into a need to locate the missing part and begin to expedite it if necessary. Parts that do not arrive in the red zone on time typically means that if extreme actions aren’t taken (i.e. expediting the part), the part will be late arriving at shipping and late to the customer.

Using these three buffer zones is imperative to the success of DBR, but there is also improvement data available that can be used as well. If your parts are always arriving in the green and yellow zones, then it probably means that your calculated buffer time is too large and can be reduced. Conversely, if your parts are always arriving in the red zone, then your buffer is too small and should be increased or that you have incorrectly identified your CCR and that the true CCR is somewhere else.

In my next blog I will get more into the details of how DBR works, how to calculate buffer times, and the positive implications of a successful DBR will mean to your company. I look forward to your questions and comments.

1 – The Measurement Nightmare – How the Theory of Constraints Can Resolve Conflicting Strategies, Debra Smith – 2000 –CRC Press LLC – Boca Raton, FL

http://www.sproullconsulting.com/

Saturday, September 11, 2010

Focus and Leverage Part 10

In my last blog posting we discussed how to find waste and variation and finished with an explanation of different types of variation. When Goldratt introduced the world to his Theory of Constraints, he did so by laying out his five focusing steps. His second of five steps was to decide how to exploit the constraint or in other words, how to wring the maximum efficiency out of the constraint. Not just maximizing the efficiency, but because the constraint dictates the performance of the organization or more specifically dictates the system throughput, how do we maximize our throughput. In step 2a we will develop our plan on how to exploit the constraint.


My advice to you is very straight forward, if you want your plan to be executed, then keep it simple! Probably many of you have project management software, but I have seen many teams get bogged down in the details of the plan and end up with a failure to launch! Please don’t let that happen. Keep it simple, direct and easy to understand and it will be executed. Many times I simply used a Word Table or an Excel Spread Sheet because they’re easy to use and update. Keep the plan visible in or near the constraint since that’s where most of the action will be.

Ok, so what should be in the plan? At the end of this blog I have posted an example of a simple plan that you can use as a guide. You already know what you’re going to attack, based upon what you found or discovered in Steps 1b and 1c, so your plan will be built around your findings.  The example in this blog is only a sample of part of a plan I developed for a company. It is only intended to give you an idea of how simple your plan should look.

As you can see, the Constraint Improvement plan is simple, uncomplicated, straight-forward and follows the actions prescribed in the Ultimate Improvement Cycle. Also notice that there aren’t details on how things like the DOE will be performed or what will happen during the 5S. This plan is simply intended to be a document that will be used to define the required activities, expected outcomes, who is responsible for making things happen, and reviewing progress against each of the action items. Each one of the teams will develop there own detailed plan, so again, don’t make your Constraint Improvement Plan overly complicated and be sure to use it for its intended purpose. I have seen so many examples where teams spent an inordinate amount of time on developing the plan at the expense of its execution. Review your plan on a regular basis and make it visible for everyone to see.

Two final points regarding the improvement plan. The first point is that the order in which you plan and execute is strictly a function of the current status of your operation. For example, if you have a major problem with equipment downtime, then activities aimed at reducing downtime should be included in the early stages of your plan. If you have problems related to defective product, then your early efforts should be focused here. The point is, there is no cookie-cutter approach or step-by-step recipe for the order in which activities are planned and executed. It is all dependent upon your own situation and status.....your own current reality.

The second point to remember is that you must involve the right players as you develop the improvement plan. The most important members of the team are the hourly operators that will be responsible for operating the new process and making product when the new process is ready. Operators are so often left out of planning activities when in fact they are the people with the most information……the true process experts. My advice is very clear-cut, if you want your plan to work, then you better involve the operators. In addition, the operators must be provided assurance that they are not planning themselves out of a job. The worst possible thing that can happen is that as cycle times are reduced, or defects and downtime are eliminated, people get moved out of their jobs or, worse yet, laid off. If this is your strategy, then I suggest that you stop right now because it’s a strategy for disaster. If this were to happen even one time, you will lose your sense of team and the motivation to improve, so do not lay people off! I realize that business conditions can change or the economy can take a downturn and that there are times when you simply can’t avoid layoffs, but if people sense that the reason their fellow workers are losing their jobs is because of improvements to the process, then improvements will stop immediately.
Bob Sproull

Sunday, September 5, 2010

Focus and Leverage Part 9

In Part 8, I discussed Step 1a of the UIC and explained why Performance Metric selection is so important as well as identifying the current and next constraint. Today, I want to discuss Steps 1b and 1c and as you will see, I use both Lean and Six Sigma for these two important steps. In Step 1b we are attempting to Define, Measure and Analyze Non-Value-Added (NVA) waste in the constraint operation while in Step 1b, we are completing the same D-M-A steps, focusing on sources of variation. It is important to remember that in these two steps, we are not taking action to reduce or eliminate waste and variation yet…..we are only recognizing its existence. It is my belief that one of the primary reasons many improvement initiatives fail is because of this compulsion to find and react immediately to sources of waste and variation, but I disagree with this approach. In my opinion, it is this compulsion to do everything “right now” that creates a disjointed improvement effort.

Waste and variation reduction efforts are not effective if they aren’t done so with a systematic plan that ties both of these steps together. You want waste and variation to be attacked concurrently to ensure that any changes made in the name of waste reduction aren’t negatively impacting variation and vice-versa. Remember that for now, because the constraint dictates throughout and increasing throughput yields the highest potential for significant profitability improvement, you are focusing your waste and variation reduction efforts on the constraint. The exceptions to this would be upstream process steps causing the constraint to be starved or downstream process steps are scrapping product or causing excessive rework. You cannot ignore these two exceptions. But primarily, you will be focusing your improvement efforts on the constraint.

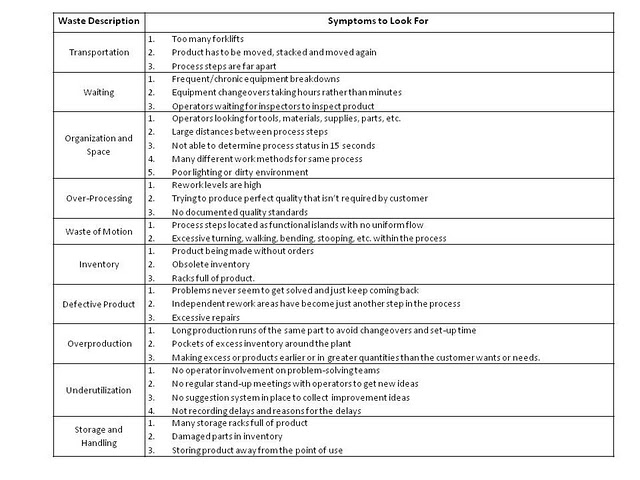
The figure below is a tool that I have successfully used many times to search for waste in processes. You will notice that I have listed ten different sources of waste and symptoms of their existence instead of the traditional eight. I do this to be as specific as I can in my search. For example, I list over-production and inventory separately because the negative impact of over-production exhibits completely different symptoms than waste of inventory and will require different actions to correct. It helps me focus better.


I now want to turn my attention to variation. There are two types of variability that you are interested in. No, I’m not talking about special cause and common cause. I’m talking about processing time variability (PTV) and process and product variability (PPV) which are very different from each other. Sources of PTV are those things that prolong the time required for parts to progress through each of the individual process steps while PPV are those variables that cause part’s quality characteristics to vary. PPV has a profound impact on PTV simply because PPV negatively interrupts the process flow. There are many examples of situations that disrupt processes and therefore, create variation. Some of the more common examples include unreliable equipment (PTV and PPV), lack of standardized work procedures (PTV and PPV), defective product (PPV and PTV), late deliveries from external and internal supplier (PTV) and many others.

Variability encumbers a factory because it simply leads to congestion, excessive inventory, extended lead times, quality problems and a host of other operational problems. There are two prominent theories on variation and how to treat it. Shewart’s idea was to “minimize variation so that it will be so insignificant that it does not, in any way, affect the performance of your product.” Taguchi, on the other hand, tells us to “construct (design) the product in such a way that it will be robust to any type of variation.” They’re both right, of course. So what are your options when dealing with the negative effects of variation? There are three ways to handle variation….eliminate it, reduce it or adapt to it. Because it’s impossible to eliminate variability, you must reduce it as much as possible and then adapt to the remaining variation. In a later posting I will discuss the subject of variation in depth and why it is so important to attack it with a vengeance.

In my next blog posting we’ll discuss how to develop an effective “attack plan” using the UIC as a guide. As always, I welcome all comments and hope that this blog is still providing value to everyone reading it.

Bob Sproull B/S

http://www.sproullconsulting.com