Tuesday, April 28, 2020

Maximizing Profitability Part 15


There has been push-back by some people on the whole concept of Throughput Accounting and as a result, they don’t buy into using TA as a reason for integrating TOC, Lean and Six Sigma. So, let’s put the financial side of this integration to the side for a moment. In addition to the financial case made for integrating these three improvement methodologies, there are other rational and logical reasons why this integration works so well. In attempting to answer which of these three initiatives a company should use or “which tune a company should dance to,” Thompson* presents an excellent summary of the fundamental elements, strengths and weaknesses for each improvement initiative. In doing so, Thompson has inadvertently (or perhaps purposely) answered the underlying question of why the three improvement initiatives should be combined and integrated rather than choosing one over the other.


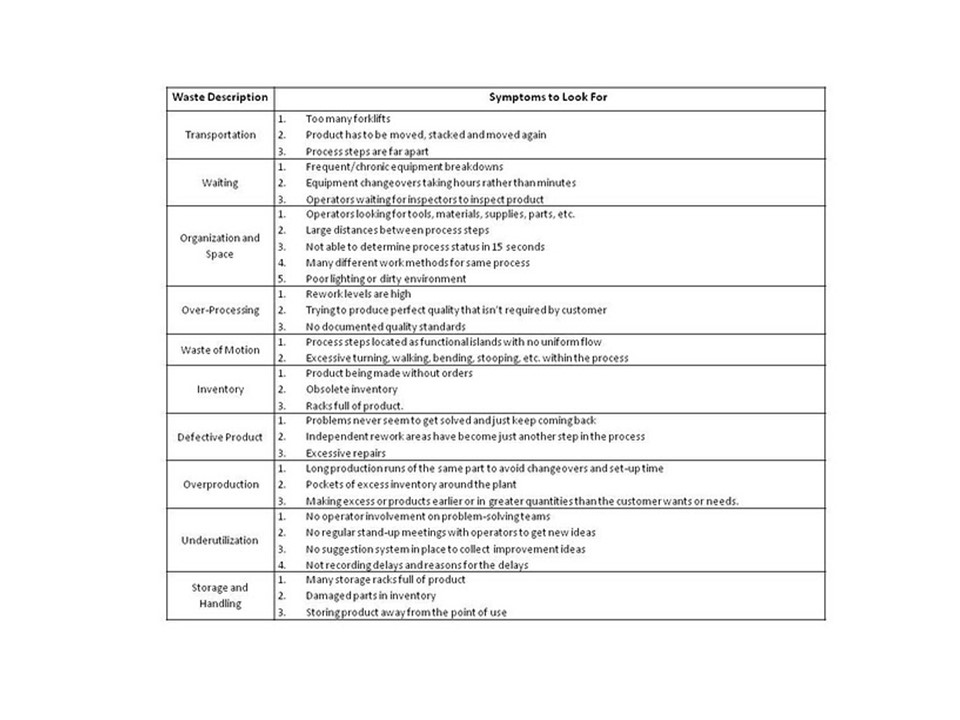
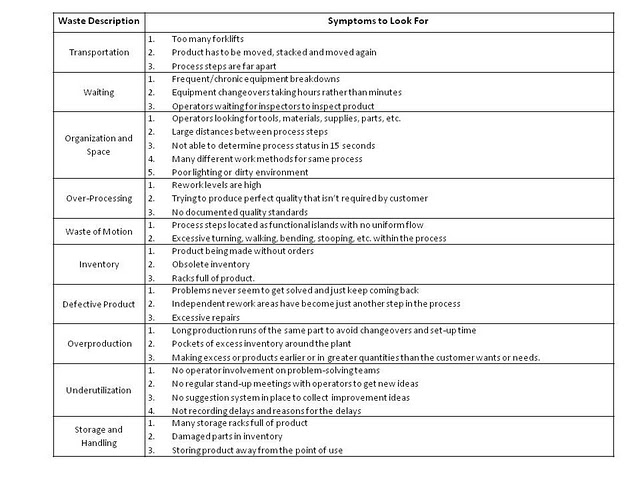
The first four columns in the table below reflect the summary of Thompson’s comparison (i.e. the initiative, fundamental elements, strengths and weaknesses). I have added a fifth column, “Counter Balance” that demonstrates how the strengths of one initiative counter-balance or compensate for the weaknesses of the others. As a matter of fact, by comparing each of the weaknesses and strengths of each of the three initiatives, we see that all of the weaknesses of each individual initiative are neutralized by one or both of the strengths of the other two. This is such an important point for those companies that have experienced implementation problems for any of the three individual improvement initiatives done solo. Let’s look at several examples.


The table tells us that Weakness 1 in Lean, “May promote risk taking without reasonable balance to consequence,” is counter balanced by Six Sigma Strength 3, “The focus on reduction of variation drives down risk and improves predictability.” One thing we know for certain is that as we reduce variation in our process, we reduce risk and our ability to predict future outcomes improves dramatically. This is the cornerstone of statistical process control which means that risks can be minimized if we rely on this Six Sigma strength to do so. Continuing, Lean Weakness 2 tells us that we may not provide sufficient evidence of business benefit for traditional cost accounting. This weakness is countered by both Six Sigma Strength Number 2, the data gathering provides strong business cases to get management support for resources and by TOC Strength Number 4, provides direction on appropriate simplified measures (Throughput, Inventory and Operating Expense). As I have stated many times before, traditional cost accounting induces us to make incorrect decisions, so by adopting Throughput Accounting practices, from the Theory of Constraints, we will have sufficient evidence to make changes to our process, assuming we are focusing on the constraint operation.


Lean Weakness 3 states that Lean has a limitation when dealing with complex interactive and recurring problems (uses trial and error problem solving) is countered by Six Sigma Strength 1, the rigor and discipline of the statistical approach resolves complex problems that cannot be solved by simple intuition or trial and error and TOC Strength 3, (distinguishes policy vs. physical constraints). One of the Six Sigma tools that permit us to solve complex interactive and recurring problems is designed experiments (DOE). DOE’s identify significant factors that cause problems and identifies insignificant factors that do not. TOC Strength 3 helps us in two ways. First, if the problem we are facing is a policy constraint, we use TOC’s Current Reality Tree to identify it and TOC’s Evaporating Cloud to solve it. Both of these strengths will compensate for this weakness in Lean.


Now let’s look at one of the Six Sigma and TOC weaknesses and see how they are compensated for by other strengths. For example, look at Six Sigma Weakness 2, the heavy reliance on statistical methods by its very nature is reactive, as it requires a repetition of the process to develop trends and confidence levels. This weakness is off-set by lean strength 2, directly promotes radical breakthrough innovation, and by lean Strength 3, emphasis on fast response to opportunities (just go do it). Likewise, TOC Weakness 3, TOC’s inability to address the need for cultural change, is off-set by Lean strength 4.

In the same way, if we compare all of the weaknesses in Lean, Six Sigma and TOC to the strengths found in the other initiatives, the three initiatives not only complement each other, but they rely on each other. So, in addition to the demonstrated financial benefits of this symbiotic trilogy, we now see evidence from a logical perspective as to why they should be implemented in unison as a single improvement strategy.

* Steven W. Thompson, Lean, TOC or Six Sigma Which tune should a company dance to?, Article in e-newsletter, Lean Directions.


Sunday, April 26, 2020

Maximizing Profitability Part 14


In my last blog I told you not to just jump right into the UIC and begin the improvement process. In this blog posting I’m going to give you 10 prerequisite beliefs that your organization must embrace before your organization will be able to successfully implement and navigate through the Ultimate Improvement Cycle:

1. Believing that leveraging the constraint and focusing your resources on the constraint is the key to improved profitability. Because of this, the constraint can never sit idle.

2. Believing that it is imperative to subordinate all non-constraints to the constraint. If you violate this key belief, your throughput will not improve and your WIP will grow to unacceptable levels thus draining cash from your coffers.

3. Believing that improving your process is a never-ending cycle. You must be ready to re-focus your resources when the constraint moves and it will move eventually.

4. Believing that involving and empowering your total workforce is critical to success. Your work force has the answers if you will first listen to what they have to say and then engage them to design the solution.

5. Believing that abandoning outdated performance metrics like efficiency and utilization, reward or incentive programs, and variances is essential to moving forward. As Goldratt says in his book, The Goal, “Show me how you measure me and I’ll show you how I’ll behave.” These outdated metrics and practices are archaic tools from the past….so let them go.

6. Believing that excessive waste is in your process and that it must be removed. Studies have confirmed that typical processes have less than 10% value-added work meaning that waste accounts for 90% of the available time.

7. Believing that excessive variation is in your process and that it must be reduced. One of the keys to growth in profitability is consistent and reliable processes. Processes are full of variation and uncertainty and unless and until variation is reduced, moving forward will be difficult.

8. Believing that problems and conflicts must be addressed and solved. You can no longer afford to hide problems with inventory. When problems arise, you must stop the process and take the time to solve them. By solving them, I’m talking about finding and eliminating the root cause(s).

9. Believing that constraints can be internal, external, physical or policy or any combination of the four. In the real world, over 90% of all constraints are policy related. Policies and procedures must be scrutinized, changed and sometimes thrown in the garbage and replaced with policies that make sense.

10. Believing that the organization is a chain of dependent functions and that systems thinking must replace individual thinking. It is no longer acceptable to focus on improving single steps in the process if it isn’t the weakest link. This focus on local optima must be replaced with system optimization.

If your entire operation is able to accept the prerequisite beliefs of constraint focus and leverage, then you have taken the first step, but it must include everyone….and every department. Your entire organization must become focused on the leveraging power of the constraining operation. If you can’t do that, then there simply is no need to continue. Unless and until all functional groups within your organization are singing from the same sheet of music, you simply will not make any progress.

Of all the TOC focusing steps, subordination will be the most difficult one to apply. It simply means that every decision made and every action taken by the entire organization must be done so based on its impact on the constraining resource. And when I say the entire organization, I mean everyone!

Accounting must provide real time decision-making information to the organization and not hold onto financial measures that are based on what happened last month. Accounting must also eliminate outdated performance metrics like utilization and efficiency in non-constraint operations because they mean absolutely nothing. Purchasing must order parts and materials based upon the rate of consumption at the constraint and stop ordering in large quantities or only on the basis of lowest cost to satisfy another outdated performance metric, purchase price variance. Sales and Marketing must understand that unless and until the current constraint is broken, they must not make hollow promises on delivery dates in order to obtain more orders to supplement their sales commissions. Engineering must respond quickly to the needs of production to assure timely delivery and updates to specifications. Maintenance must always prioritize their work based upon the needs of the constraining operation including preventive and reactive maintenance activities. If there is an inspection station that impacts the constraint throughput, then inspectors (if they exist) must always provide timely and accurate inspections so as to never cause delays that negatively impact the flow of materials into and out of the constraint. Finally, Production Control must stop scheduling the plant on forecasts that we know are wrong using the outdated algorithms contained within the MRP system.

As you identify the constraint and subordinate the rest of the organization to the constraint, there will be idle time at the non-constraints. If you are like many organizations that use total system efficiency and utilization as key performance metrics, then you will see both of them predictably decline. You are normally trying to drive efficiencies and utilizations higher and higher at each of the individual operations under the mistaken assumption that the total efficiency of the system is sum of the individual efficiencies. In a TOC environment the only efficiencies or utilizations that really matter are those measured in the constraint operation. You may even be using work piece incentives in an effort to get your operators to produce more and I’m sure many of you are using variances as a key performance metric. Efficiencies, utilizations, incentives and variances are all counterproductive!

Believe me, no matter how good you think your processes are, they are full of waste and variation. You must accept the premise that every process contains both excessive amounts of waste and variation that are waiting to be identified, removed, and reduced. Your job will be to locate, reduce and hopefully eliminate the major sources of both. Variation corrupts a process, rendering it inconsistent and unpredictable. Without consistency and control you will not be able to plan and deliver products to your customers in the time frame you have promised. Waste drives up both operating expense and inventory, so improvements in both of these go directly to the bottom line as you improve the throughput of your process and more specifically your constraining operation. Yes, you will observe waste in your non-constraint operations, but for now focus your resources only on the constraint!

If your organization has truly accepted these ten prerequisite beliefs and all that goes with them, then you are ready to begin this exiting journey that has no destination. But simply saying you believe something can be hollow and empty. It is your day-to-day actions that matter most. Review these ten prerequisite beliefs as a group on a regular basis and hold people and yourself accountable to them. Post them for everyone to see. Utilizing the Ultimate Improvement Cycle and true acceptance of and employment of these ten beliefs will set the stage for levels of success you never believed were possible!


Thursday, April 23, 2020

Maximizing Profitability Part 13


In my last blog we completed the first rotation of the Ultimate Improvement Cycle, so now it’s time to get started with your own cycle of improvement. In the first twelve blog entries, I laid out the Ultimate Improvement Cycle and have hopefully convinced you of its value for your company. If I have convinced you, then you probably are wondering about the best way to get started. “Do I go out and just start at step 1a of the Ultimate Improvement Cycle?” The answer is no, because if you did that, you would almost immediately begin hitting barriers and obstacles that would limit your success or maybe even question the validity of this cycle of improvement. So if not step 1a, then what?


Let’s first consider the question of what we are attempting to do. I started this series of postings by stating that the basic goal of all “for profit” organizations is to make money now and in the future. If you’re already making money, perhaps your goal might be better stated as to make more money now and more money in the future. If this is your goal, then the question I would ask myself is, “What is preventing me from making more money now and more money in the future?” My experience tells me that there are a host of things that prevent companies from making more money.

In its most basic form, making money involves generating revenue that is greater than what it costs to generate it. So obviously if operating expenses are too high and you aren’t generating enough revenue, then you won’t make money. So the question is just how do you generate more revenue? Assume for a moment that you have more orders than you have capacity to fill them. Since you are unable to satisfy market demand, it follows that your throughput is too low. If your throughput is too low, it also means that your cycle times are too long. So then the key to generating more revenue must be reducing cycle times. How do we reduce cycle times? Let’s first look again at Little’s Law.

Since Little’s Law states that Cycle time equals WIP divided by Throughput (i.e. CT = WIP/T) it should be clear that reducing cycle time implies reducing WIP as long as Throughput remains constant. So if you have large amounts of WIP, then clearly you have an opportunity to reduce cycle time. But what if you don’t have large amounts of WIP in your plant (I’m betting you do though)? How else might we reduce cycle times?

We know that cycle time is equal to the sum of all processing times for each process step. We also know that cycle time is the sum of all value-added time plus all non-value-added time in the total process. So if we want to decrease cycle time, then we have three choices:

1. We can reduce value-added time

2. Reduce non-value-added time

3. Do some of both.
As is demonstrated in the above figure, non-value-added time by far and away accounts for the largest percentage of total cycle time in all processes. This would imply that if we significantly reduce non-value-added time in our process, then we could significantly reduce cycle time which would, in turn, significantly improve our Throughput and Revenue. So what are these non-value-added times that I’m referring to? Just think about which activities add value versus those that do not. Let’s make a list.

1. Transport time – moving product from point A to point B.

2. Set-up time – converting a process from one configuration to another.

3. Queue time – time spent waiting to be processed

4. Process batch time – time waiting within a batch

5. Move batch time – time waiting to move a batch to the next operation which could also include time in storage

6. Wait-to-match time – time waiting for another component to be ready for assembly

7. Drying time – time waiting for things like adhesives to become ready to be assembled

8. Inspection wait time – time waiting for products to be inspected

There might be others we could add to our list, but for now assume this is our list. Which of these items add value? Clearly none of them do, so they would all be classified as non-value-added. There obviously are things we could do to reduce each one of these. For example, process batch time is driven by the process batch size, so we could do two things that would reduce this time. We could optimize the batch size that we produce and in conjunction with this we could reduce the time required for set-up. In doing these two things we would probably also reduce the move batch time and maybe even the wait-to-match time. Clearly these actions would reduce the overall cycle time.

But even if we were successful in reducing cycle time, we would not realize a single piece of throughput unless we reduced the processing time and non-value-added time of the operation that is constraining the throughput, the system constraint. Any attempts to reduce processing times in operations that are not constraining throughput are quite simply wasted effort.

The key to making more money now and in the future is, in reality, tied to two single beliefs, focus and leverage. In TOC terminology these two beliefs of leverage and focus are fundamental to the idea of exploiting the constraint. If you want to increase your throughput, then there is only one effective way to accomplish it. You must leverage the operation that is limiting your throughput, your constraint operation! And how do you leverage your constraining operation? You do so by focusing your available improvement resources on your constraint and reduce the non-value-added and value-added times within the current cycle time. It’s really that simple!
So are you ready to begin your own cycle of improvement now? Not quite…. there are other important things that you must consider before beginning your own cycle of on-going improvement. There are 10 prerequisite beliefs that apply to your organization that must be considered before you begin your journey. In my next blog post, I will articulate these beliefs for you and then you will be ready to begin.

Tuesday, April 21, 2020

Maximizing Profitability Part 12


One of the key points to remember regarding the implementation of Drum-Buffer-Rope is that it will not be sustainable unless traditional performance metrics like operator efficiency, machine utilization and incentive systems are either abandoned or radically changed to be compatible with the principles of TOC. So, if these aren’t the correct metrics to track in non-constraints, then what metrics should we track. In my last posting we discussed buffer status….doesn’t it make sense that the non-constraint metrics should be measuring, in some form, how we are doing with respect to buffer management?


Remember, the properties of good performance metrics are:

• They must be objective, precisely defined, and quantifiable

• They must be well within the control of the people or process that is being measured

• They must stimulate the right behaviors
So, what behaviors are we trying to encourage in non-constraint operations? Think for a moment about the function of a non-constraint. First, a non-constraint in front of a constraint can never let the constraint starve. If it did, valuable throughput would be lost to the system. By the same token, a non-constraint downstream from the constraint can never be permitted to produce scraps because that too would be throughput lost to the system. Secondly, you know that protective inventory in front of the constraint simply adds unnecessary cost to the organization. Third, you know that the constraint operation sets the pace for all other resources, so schedule compliance in a non-constraint becomes important. So based upon these three functions, there are four generic metrics that should be considered:


  • Workstation availability: The percentage of time the non-constraint was available to make product.
  • Yield: The percentage of “good” product produced for the constraint operation (or for downstream operations supplying the shipping buffer).
  • On-Time Delivery to the next operation:  The percentage of compliance to schedule.
  • Protective Buffer (parts and/or time) in front of the constraint, assembly, and shipping too much (greater than 100 percent. Percentage of protective buffer too little (less than 100 percent)

The final decision on which metrics to use for a non-constraint is situation dependent, but the decision should be based upon:

• Never starving a constraint operation (or shipping buffer)

• Impact of too little or too much inventory in the system

• Schedule compliance

Let’s finish the discussion on the UIC by looking at steps 4a, 4b and 4c. In these three steps we are concerned with planning how to elevate a constraint if it is necessary, actually elevating it and then implementing protective controls to sustain the gains we have made.

With any luck, by following the steps I’ve presented, you will have increased the capacity of your constraint to meet the demands of the marketplace. If this is the case, then other, more extreme actions must be taken which usually involve spending some money. You have eliminated much of the waste and reduced variation, both of which have had a positive impact on cycle time and throughput, but you’re not quite there yet as far as producing enough product.

Goldratt’s fourth step tells us, if necessary, elevate the constraint. Increasing the capacity of the constraint can be done in a variety of ways like, using overtime, adding resources, purchasing additional equipment, etc. One thing you must keep in mind when you are elevating the constraint is what will happen when you are successful with this elevation. Remember back in Step 1, we said that you should identify both the current and next constraint? We did this for a reason. Suppose you have decided that in order to elevate the constraint, you must purchase a new piece of equipment. Your justification should only demonstrate the throughput improvement up to the limit of the next constraint. That is, if your current constraint is currently producing 5 parts per hour and you purchasing a new machine will double that to 10 parts per hour, that improvement is only correct if the next slowest resource is at 10 parts (or above) per hour. If, for example, the next constraint in the process is only producing 7 parts per hour, then you really can only claim a gain in throughput of 2 parts per hour for the new equipment. All I am saying is that make sure you consider the total process when making you decision on how to elevate the current constraint.

The final step in the UIC is to Implement Controls to Sustain the Gains. Sustaining the gains is the hallmark of great organizations, so how do we do this. Of course, if you have chosen the right performance metrics and you’re tracking them, this is one way, but is it the best way? One of the most effective tools to protect and preserve your accomplishments is by using a simple process audit. A typical process audit is a series of questions asked to the line leader and/or supervisor to demonstrate the status of the process. These questions should be focused upon how elements of your new process are working and to demonstrate that they are being used as intended. For example, suppose part of your plan involved implementing a control chart. Your questions would be focused on whether or not it’s being used; if out-of-control data points are being investigated, etc. You would of course then check the status of the control chart to verify the responses. These audits should not be planned in advance, but rather be done in a random time frame. One of the reasons audits of this nature fail to add value is that many times they are announced in advance. Anyone can look good for a day if they are given enough advanced notice. I also advocate having leadership perform some or all of these audits simply because it adds credibility to them. If leadership thinks they are important, then everyone else will too. In addition, I recommend scoring the audit by % compliance and posting the audit score as demonstrated in the  figure below.


You have just completed one revolution of the Ultimate Improvement Cycle and things should be greatly improved. Your throughput has increased, your cycle times are reduced, your quality is better, there is less variation and uncertainty and your bottom line is much better. Don’t stop here….move on to your next revolution and start the process all over again. This is your new Process of On-Going Improvement…your POOGI. Good luck! 

Thursday, April 16, 2020

Maximizing Profitability Part 11


In my last blog I introduced the basics of Drum-Buffer-Rope (DBR) including how holes in the three buffer zones can form the basis for your improvement efforts. That is, if the holes are always occurring at the same location for the same reason, then improvement efforts should be focused there. Today, I want to get into more of the details of how DBR works, how to calculate buffer times and some of the positive implications of a successful DBR implementation.


In DBR, the drum is the constraining resource and the pace of the drum sets both the priority and work schedule for your process. The buffer is the time placed in front of both the constraint and shipping to protect the due dates for both. Our ability to meet these two due dates is dependent upon two things:

1. We must make certain that the buffer is large enough to accommodate all of the uncertainties (Murphy) that rear their ugly head and chew away at our buffer so that our schedule is achieved.

2. We must make certain that the release of raw materials is done on time to guarantee that the constraint is never starved and that the shipment date is never compromised.

The rope is the length of time needed to complete the processes that are in front of the drum. It is the signal sent to the beginning of the process to release raw materials on time. So let’s talk about how we calculate these buffers.

Although this may sound overly simplistic, proper buffer sizing only occurs by monitoring it. By that I mean if parts are always arriving in the green and yellow zones, then the buffer is most likely too big. Conversely, if the parts are always in the yellow and red zones, then the buffer is most likely too small. Goldratt has suggested that an initial buffer size can be calculated by taking one-half of the current lead time and dividing that time between the constraint buffer and the shipping buffer. This initial buffer size can then be adjusted up or down depending upon when the parts are arriving. Another way of saying this is, if you are always in the expediting mode, then your buffer is too small. If you are never expediting, then your buffer can be reduced. This attention to buffers is referred to as buffer management.

Each open work order or production batch will have a buffer status that we can calculate. For example, based upon the buffer status we can relate the color code to a percentage of buffer consumed as follows:

1. Green Orders: If the buffer status is greater than 67%, then there is still plenty of time to complete it so no expediting is ever required.

2. Yellow Orders: If the buffer status is between 33 and 67%, then disruptions have occurred and there is a risk that any additional disruptions might cause the order to be late, but there is still ample time so no expediting is needed. However, it will be important to track this order more closely than normal.

3. Red Orders: If the buffer status is less than 33%, then any further disruption will definitely result in a late order. Therefore, close scrutiny of this order is required and the probability of the need for expediting is very high.

It is important to understand that buffer status changes with time and as time moves forward, the buffer status may change. I recommend, at a minimum, that buffer status be checked at least once per shift and that a quasi FIFO priority system be used with red orders being first, followed by yellow orders and then green orders.

Using color codes offers another advantage in that if records are kept as to why orders consistently fall into a yellow or red zone, then an opportunity for improvement exists. If a repeating root cause exists, then solving that problem will provide the opportunity to reduce the overall lead time which translates into a competitive advantage for your company.


The three main elements of DBR are:

1. A shipping schedule which is based upon the rate that the constraint can produce orders (i.e. Throughput)

2. A constraint schedule which is tied to the shipping schedule.

3. A material release schedule which is tied to the constraint schedule.

Visually these three elements might look like the Figure 1 displaying the three elements and the interconnectedness of each. You will notice that in addition to the constraint and shipping buffer, there is a third buffer, the assembly buffer. I included this in the event that your process involves an assembly that requires the constraint part before it is completed. That must be accounted for as well if part of your process includes assembly.

In my next blog we will complete our discussion of Drum-Buffer-Rope and move on to the next step in the Ultimate Improvement Cycle.


Saturday, April 11, 2020

Maximizing Profitability Part 10


In my last posting, we discussed the development of a Constraint Improvement Plan and I gave you an example of such a plan. In Steps 2a and 3a of the UIC, you are reducing waste and variation primarily in the constraint by executing your plan. Our focus thus far has been on the constraint, but now it’s time to turn our attention to non-constraints. You will recall that the third of Goldratt’s five focusing steps is, subordinate everything else to the constraint. Just exactly what is a non-constraint? In TOC jargon, a constraint is any resource whose capacity is less than the demand placed on it and a non-constraint is any operation whose capacity is greater than the demand that is placed on it. So theoretically, constraints limit throughput while non-constraints do not, but as you will see, the reality is that this is not always true. So why did Goldratt believe that it was so important to subordinate everything else to the constraint? To quote [1] Debra Smith, “The ability to subordinate will define a company’s ability to succeed with the Theory of Constraints. Exploitation of the constraint is dependent upon effective subordination.”


The key role of non-constraints is to guarantee that the constraint always has work exactly when it is needed so as never to allow starvation of the constraint. Constraint starvation translates directly into lost throughput which negatively impacts profitability. The most effective method I have found to assure that constraint starvation does not occur is by using a TOC based scheduling system called Drum-Buffer-Rope (DBR). DBR is designed to regulate the flow of product through a production line based upon the processing rate of the most constrained resource, the capacity constrained resource (CCR). In a DBR system, the production rate of the CCR is equated to the rhythm of a drum. To protect the drum (CCR) from starvation, a time buffer is placed in front of it which is the average amount of time required for raw materials to be released into the process and processed by the up-stream non-constraints in time to reach the CCR. In order to guarantee that product reaches the drum on time, a signaling mechanism, referred to as a rope, connects the drum (CCR) to the raw material release for the first operation. Therefore, the first purpose of the rope is to ensure that the CCR is never starved. By the same token, we want to guard against excess WIP entering the system and the rope prevents this as well. Incidentally, the derivation of the term DBR is found in Goldratt’s book, The Goal, so if you haven’t ever read it, I strongly encourage you to do so. Because of the importance of DBR, the next couple of postings will focus on the implementation of DBR.


The first step in any kind of TOC based implementation is to correctly identify the constraint, or more specifically, the Capacity Constrained Resource (CCR). The slowest resource in any production operation is the CCR which sets the pace for every other part of the process. Any other resource that out-paces the rate of the CCR only serves to increase Operating Expense (OE) and Inventory (I) if it is permitted to run at maximum efficiency. In fact, maximizing production at non-constraints will always result in large levels of Work In Process (WIP) inventory, long cycle times, more labor than is required, increased demands for storage, and a larger than required investment in raw materials which ties up cash. The objective here is to provide exceptional due-date performance while minimizing inventory and DBR offers the solution to this conundrum.


The basic premise for scheduling and production management is that different resources have different capacities and because statistical fluctuations and unplanned disruptions exist and can never be truly eliminated, any solution must take this fact into account. The reality is that the CCR must be protected from “Murphy” who enters all processes in the form of random statistical fluctuations and interdependencies. Interdependencies means that a resource must wait for another resource to finish before it can start to work. DBR uses three strategically placed buffers to guard against these two forms of Murphy as follows:

  1. A buffer in front of the CCR to prevent starvation of the CCR if Murphy strike any resource in front of the CCR.
  2. A buffer in front of assembly if a CCR part is required to complete the assembly.
  3. A buffer in fron of shipping to assure on-time delivery in the event that Murphy strikes upstream of shipping.


It is important to understand that these three buffers are in the form of time rather than products, and that the management of these buffers is critical to your success using DBR. So the question becomes, if time is the buffer, then how do you know how much time is required? Before I answer that question, I want you to form a visual image of what buffer management might look like in a typical production environment.


The figure above is meant to depict any of the three buffers just presented. Remember, these buffers are time based rather than physical product. Monitoring the buffer is intended to send a signal to all concerned as to when to expedite and when not to expedite. When the part does not enter the buffer on schedule, it creates what is known as a “hole” in the buffer. The figure indicates that there are three zones, a safe zone (green), a caution zone (yellow) and an expedite zone (red) for each of the three buffer types. Each of these three zones represents 1/3 of the total calculated time in which the product must be available at that buffer location. If a hole is formed in the green zone, there is no cause for concern, while holes in the yellow zone translate into a need to locate the missing part and begin to expedite it if necessary. Parts that do not arrive in the red zone on time typically means that if extreme actions aren’t taken (i.e. expediting the part), the part will be late arriving at shipping and late to the customer.


Using these three buffer zones is imperative to the success of DBR, but there is also improvement data available that can be used as well. If your parts are always arriving in the green and yellow zones, then it probably means that your calculated buffer time is too large and can be reduced. Conversely, if your parts are always arriving in the red zone, then your buffer is too small and should be increased or that you have incorrectly identified your CCR and that the true CCR is somewhere else.


In my next blog I will get more into the details of how DBR works, how to calculate buffer times, and the positive implications of a successful DBR will mean to your company. I look forward to your questions and comments.


Wednesday, April 8, 2020

Maximizing Profitability Part 9


(Note: For a complete listing of steps in the UIC, refer to Parts 6 and 7 of this series.)

In my last blog posting we discussed how to find waste and variation and finished with an explanation of different types of variation. When Goldratt introduced the world to his Theory of Constraints, he did so by laying out his five focusing steps. His second of five steps was to decide how to exploit the constraint or in other words, how to wring the maximum efficiency out of the constraint. Not just maximizing the efficiency, but because the constraint dictates the performance of the organization or more specifically dictates the system throughput, how do we maximize our throughput. In step 2a we will develop our plan on how to exploit the constraint.


My advice to you is very straight forward, if you want your plan to be executed, then keep it simple! Probably many of you have project management software, but I have seen many teams get bogged down in the details of the plan and end up with a failure to launch! Please don’t let that happen. Keep it simple, direct and easy to understand and it will be executed. Many times I simply used a Word Table or an Excel Spread Sheet because they’re easy to use and update. Keep the plan visible in or near the constraint since that’s where most of the action will be.
Ok, so what should be in the plan? At the end of this blog I have posted an example of a simple plan that you can use as a guide. You already know what you’re going to attack, based upon what you found or discovered in Steps 1b and 1c, so your plan will be built around your findings.  The example in this blog is only a sample of part of a plan I developed for a company. It is only intended to give you an idea of how simple your plan should look like.


As you can see, the Constraint Improvement plan is simple, uncomplicated, straight-forward and follows the actions prescribed in the Ultimate Improvement Cycle. Also notice that there aren’t details on how things like the DOE will be performed or what will happen during the 5S. This plan is simply intended to be a document that will be used to define the required activities, expected outcomes, who is responsible for making things happen, and reviewing progress against each of the action items. Each one of the teams will develop there own detailed plan, so again, don’t make your Constraint Improvement Plan overly complicated and be sure to use it for its intended purpose. I have seen so many examples where teams spent an inordinate amount of time on developing the plan at the expense of its execution. Review your plan on a regular basis and make it visible for everyone to see.

Two final points regarding the improvement plan. The first point is that the order in which you plan and execute is strictly a function of the current status of your operation. For example, if you have a major problem with equipment downtime, then activities aimed at reducing downtime should be included in the early stages of your plan. If you have problems related to defective product, then your early efforts should be focused here. The point is, there is no cookie-cutter approach or step-by-step recipe for the order in which activities are planned and executed. It is all dependent upon your own situation and status.....your own current reality.

The second point to remember is that you must involve the right players as you develop the improvement plan. The most important members of the team are the hourly operators that will be responsible for operating the new process and making product when the new process is ready. Operators are so often left out of planning activities when in fact they are the people with the most information……the true process experts. My advice is very clear-cut, if you want your plan to work, then you better involve the operators. In addition, the operators must be provided assurance that they are not planning themselves out of a job. The worst possible thing that can happen is that as cycle times are reduced, or defects and downtime are eliminated, people get moved out of their jobs or, worse yet, laid off. If this is your strategy, then I suggest that you stop right now because it’s a strategy for disaster. If this were to happen even one time, you will lose your sense of team and the motivation to improve, so do not lay people off! I realize that business conditions can change or the economy can take a downturn and that there are times when you simply can’t avoid layoffs, but if people sense that the reason their fellow workers are losing their jobs is because of improvements to the process, then improvements will stop immediately.


Monday, April 6, 2020

Maximizing Profitability Part 8


I am now returning to my multi-part series of blog posting on maximizing profitability.  I hope many of you have signed up for Philip Marris's webinar which takes place today at 10:00 AM, Eastern Standard Time.  Once again the link to Philip's webinar is https://lnkd.in/dQW-ZPU.


In Part 7, I discussed Step 1a of the UIC and explained why Performance Metric selection is so important as well as identifying the current and next constraint. Today, I want to discuss Steps 1b and 1c and as you will see, I use both Lean and Six Sigma for these two important steps. In Step 1b we are attempting to Define, Measure and Analyze Non-Value-Added (NVA) waste in the constraint operation while in Step 1b, we are completing the same D-M-A steps, focusing on sources of variation. It is important to remember that in these two steps, we are not taking action to reduce or eliminate waste and variation yet…..we are only recognizing its existence. It is my belief that one of the primary reasons many improvement initiatives fail is because of this compulsion to find and react immediately to sources of waste and variation, but I disagree with this approach. In my opinion, it is this compulsion to do everything “right now” that creates a disjointed improvement effort.

Waste and variation reduction efforts are not effective if they aren’t done so with a systematic plan that ties both of these steps together. You want waste and variation to be attacked concurrently to ensure that any changes made in the name of waste reduction aren’t negatively impacting variation and vice-versa. Remember that for now, because the constraint dictates throughout and increasing throughput yields the highest potential for significant profitability improvement, you are focusing your waste and variation reduction efforts on the constraint. The exceptions to this would be upstream process steps causing the constraint to be starved or downstream process steps are scrapping product or causing excessive rework. You cannot ignore these two exceptions. But primarily, you will be focusing your improvement efforts on the constraint.

The figure below is a tool that I have successfully used many times to search for waste in processes. You will notice that I have listed ten different sources of waste and symptoms of their existence instead of the traditional eight. I do this to be as specific as I can in my search. For example, I list over-production and inventory separately because the negative impact of over-production exhibits completely different symptoms than waste of inventory and will require different actions to correct. It helps me focus better.


I now want to turn my attention to variation. There are two types of variability that you are interested in. No, I’m not talking about special cause and common cause. I’m talking about processing time variability (PTV) and process and product variability (PPV) which are very different from each other. Sources of PTV are those things that prolong the time required for parts to progress through each of the individual process steps while PPV are those variables that cause part’s quality characteristics to vary. PPV has a profound impact on PTV simply because PPV negatively interrupts the process flow. There are many examples of situations that disrupt processes and therefore, create variation. Some of the more common examples include unreliable equipment (PTV and PPV), lack of standardized work procedures (PTV and PPV), defective product (PPV and PTV), late deliveries from external and internal supplier (PTV) and many others.

Variability encumbers a factory because it simply leads to congestion, excessive inventory, extended lead times, quality problems and a host of other operational problems. There are two prominent theories on variation and how to treat it. Shewart’s idea was to “minimize variation so that it will be so insignificant that it does not, in any way, affect the performance of your product.” Taguchi, on the other hand, tells us to “construct (design) the product in such a way that it will be robust to any type of variation.” They’re both right, of course. So what are your options when dealing with the negative effects of variation? There are three ways to handle variation….eliminate it, reduce it or adapt to it. Because it’s impossible to eliminate variability, you must reduce it as much as possible and then adapt to the remaining variation. In a later posting I will discuss the subject of variation in depth and why it is so important to attack it with a vengeance.

In my next blog posting we’ll discuss how to develop an effective “attack plan” using the UIC as a guide.


Thursday, April 2, 2020

Special Webinar by Philip Marris

In this post I want to recommend a "Free Webinar" by Philip Marris which should be amazing.  There is a link to the details at the bottom of this posting.  For those of you who may not be familiar with Marris Consulting, in my opinion they are the best consulting company in the entire world.  So if you want to learn and apply some great things, I encourage everyone to  sign on and learn away!

Free webinar in English: “15 examples of Theory Of Constraints + Lean” on Monday 6th of April 2020, 4pm (UTC+2). Philip MARRIS will present Marris Consulting’s 15 “best of” client implementations (out of our >250 assignments) using the Theory Of Constraints combined with Lean, Six Sigma, Agile, etc. and common sense. We will cover all sorts of industries: aeronautical, pharmaceuticals, fast food, MRO, steel, automotive, luxury goods, rockets…and rapid diagnostics machines for respiratory deceases…

Since France is currently in Covid-19 total confinement we have converted what was a conference into a free webinar. It was meant to celebrate Marris Consulting’s 15th birthday… So take advantage of this exceptional event.

Monday 6th of April 2020, from 4:00 pm to 5:00 pm CEST (UTC+2), followed by a Q/A session from 5:00 pm to 5:30 pm

Details and registration: https://lnkd.in/dQW-ZPU