In my last posting I said
that I would present a case study using what I originally called the Ultimate
Improvement Cycle (UIC) but is now referred to as TLS. This case study involves a company that had been manufacturing truck bodies for the
transportation industry since 1958 and had been one of the recognized industry
leaders. The company had a staff of 17
full time Engineers and Engineering performance was measured by the number of
hours of backlog waiting to pass through Engineering, which seemed odd to me
that such a negative performance metric was being used. I had been hired in as the VP of Quality and
Continuous Improvement because the company was losing market share as well as
delivery dates being missed. In
addition, morale within Engineering was apparently at an all time low. Upon arriving at this company I was informed
that I was also to have responsibility for Engineering. Because of the poor performance in
Engineering, the company had fired their VP of Engineering and I was the
“lucky” recipient of this group.
Apparently the backlog of quotes had risen from their normal 300 hours
to approximately 1400 hours just in the previous 2 months.
My
first step was to create a high-level P-Map and a VSM to better
understand what was happening. I was in
search of the constraint or that part of the process that was limiting
throughput. It was clear immediately
that the constraint was the order entry system in that the process to receive a
request for a quote and deliver it back to the customers was consuming 40
days! And since it only took 2 weeks to
produce and mount the truck body, it was clear to me why market share was
declining. I then created a lower level
P-Map of the quoting process to better understand what was consuming so much
time.
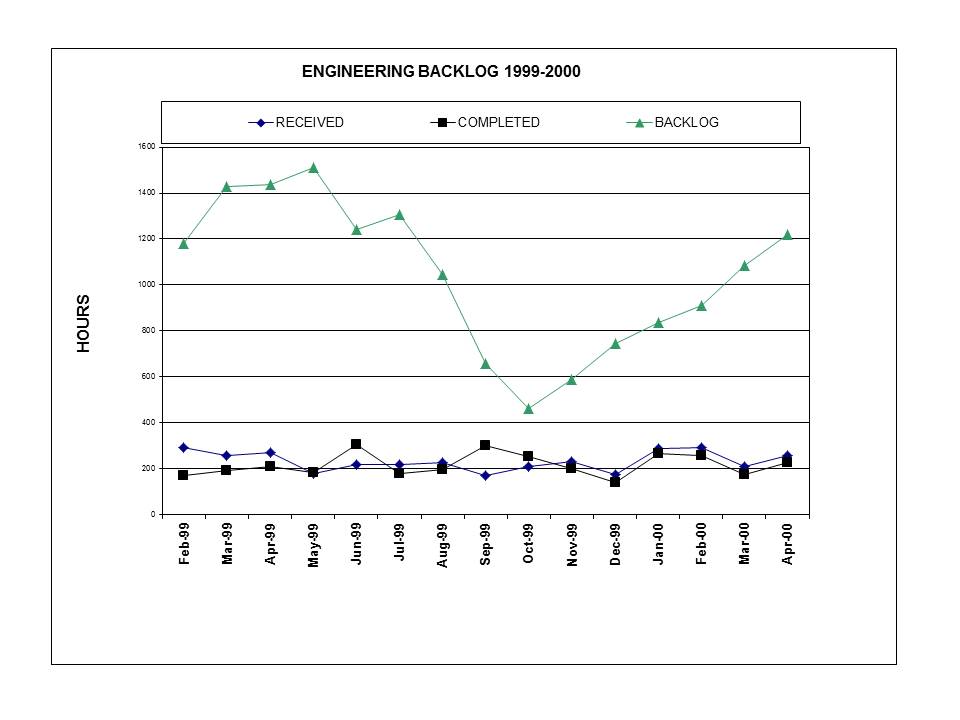
My next step was to develop a
run chart to get some history of what was happening within this process. Figure 1 represents the number of backlog
hours from February 1999 through April 2000.
The data confused me because I first observed a steady decline in
backlog hours beginning in May of 1999 through October 1999 and then a linear
increase from November 1999 through April of 2000. My investigation revealed that the decline
was associated with mandatory Engineering overtime and the ascent occurred when
the overtime was canceled. The
Engineering VP hadn’t defined and solved the problem, he had just treated the
symptoms with overtime.
My next step was to create
another run chart going back further in time.
If I was going to solve this problem, I needed to find out when this problem
actually started. Figure 2 is the second
run chart I created and it was clear that this backlog problem was a relatively
recent change, so the key to solving it was to determine what had changed.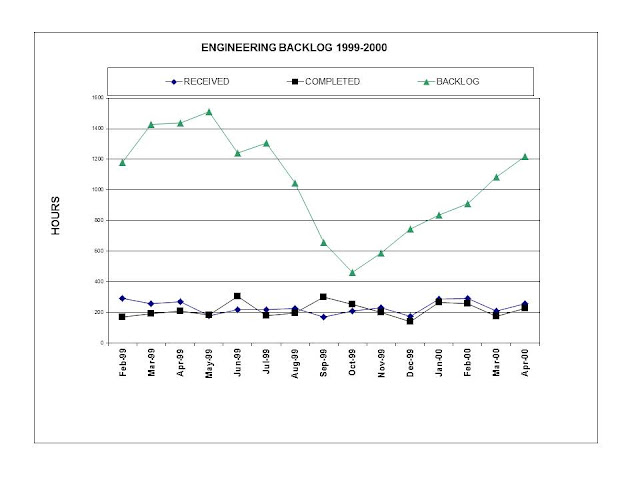 Figure
1
Figure
1
 Figure
1
Figure
1 Figure
2
Figure
2
For me, the fix was
clear. Return to the previous
Engineering configuration, identify the system constraint, focus on it and
drive out waste and variation, to drive the backlog hours lower. The results were swift and amazing in that
the backlog decreased from 1200 hours
to 131 hours in 5 weeks and has remained within an acceptable maintenance level
ever since. In fact, because we also
eliminated much of the waste within this process the time required to process
orders through Engineering decreased from 40 days to an astounding 48 hours! Figure 3 represents the final results of our
efforts. Not only had the amount of
backlog hours decreased to levels never seen before (from a historical average
of 300 hours to less than 150 hours), the number of quotes completed were at
all-time highs for the company.
 Figure
3
Figure
3
The key to this success was
to first identify the operation that was constraining throughput (the system
constraint), second, decide how to exploit the constraint by applying various Lean
and Six Sigma tools to the constraint, third, subordinate everything else to
the constraint and then if need be, break the constraint by spending
money. Thanks to Lean and Six Sigma, we
did not have to spend any money. And the
good news is, Engineering overtime was virtually eliminated while the market
share rose to unprecedented levels!
Bob Sproull
No comments:
Post a Comment