Earlier, we explained that in traditional
project management we track the progress of the project by calculating the
percentage of individual tasks completed and then comparing that percentage
against the due date. The problem with this method is that it is nearly
impossible to know exactly how much time is remaining to complete the project.
Using this method to track progress, many times you’ll see 90 % of a project
completed only to see the remaining 10 % take just as long. In fact, looking at
the number or percentage of tasks completed instead of how much of the critical
path has been completed only serves to give a false sense of conformance to the
schedule.
Critical Chain Project Management (CCPM) measures the progress of a project much differently and in so doing allows the project to make valuable use of early finishes. Critical chain uses something called a Fever Chart which is simply a run chart of % of Critical Chain Complete versus % of Project Buffer consumed. Figure 1 is an example of such a chart. In this chart we see that 20 % of the critical chain has been completed while only 8 % of the project buffer has been consumed, thus indicating that this project is actually ahead of schedule. Contrast this with Figure 2 which has completed 26 % of the critical chain, but has consumed 28 % of the project buffer, making it a bit behind schedule.
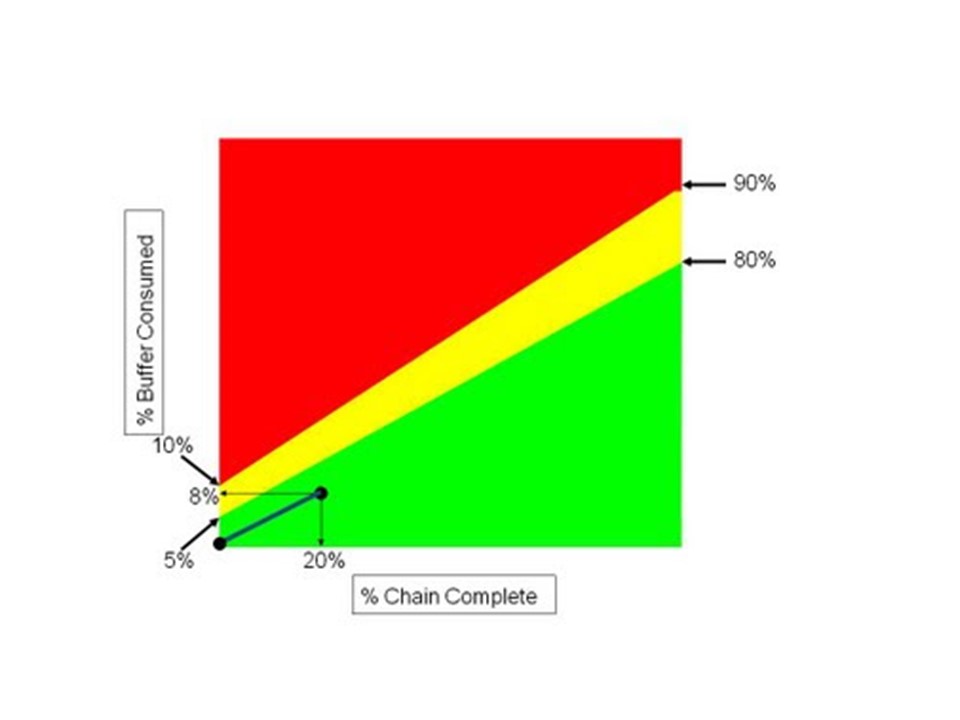
Figure 1
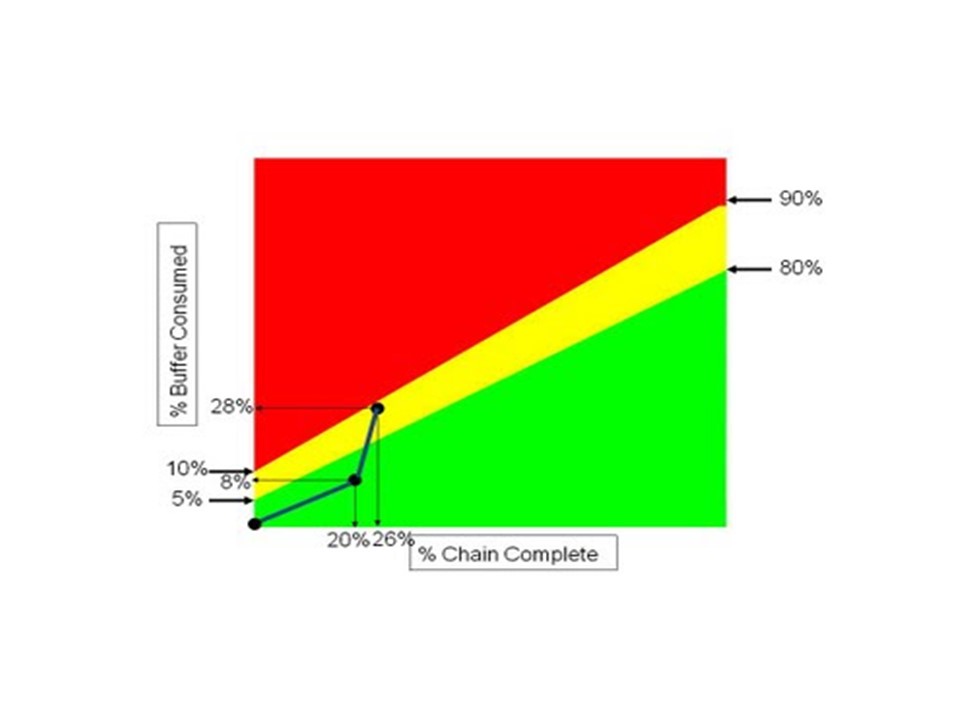
Figure 2
The green, yellow and red areas of the fever
chart are visual indicators of how the project is progressing. If the data
point falls within the green area of the chart, the project is progressing well
and may even finish early. If the data point falls into the yellow zone, there
is cause for concern and a plan on how to move the project forward should
be developed, but is not to be implemented just yet. Contrast this
with the vertical rise demonstrated in Figure 2 which indicates that
buffer is being consumed at too fast a rate relative to how the project is
progressing. If a data point falls into the red zone, as demonstrated in Figure
3, then the plan we developed should now be executed. In Figure 3 we see that
only 35 % of the critical chain has been completed while almost half (49%) of
the buffer has been used. But even if the entire amount of project buffer
is consumed at the completion of the project, the project is still on time and
not late. That is, if 100 % of the project buffer is consumed, as long as 100 %
of the critical chain has been completed, the project is exactly on time.

Figure 3
In addition to using the fever chart, we also
recommend calculating a project index by dividing the % of critical chain
completed into the % of the project buffer consumed. As long as this ratio is
1.0 or less, then the project will come in on-time or early. This means that
the rate the buffer is being consumed is in step with the progress on the
critical chain. However, if the project index goes beyond 1.0, the
project completion date could be in jeopardy. Figure 3's project index is
1.4 indicating that significant action must be taken on the critical chain to
assure an on time completion.
In my next posting I will define how
Goldratt’s 5 focusing steps apply to project management and then summarize the
key points made in this series of blogs on Critical Chain Project Management.
No comments:
Post a Comment