I want to thank all of my readers and followers of my blog. In January, I thanked everyone for taking the blog to a new all-time high of page views at 25,000 (up from a high of 12,000 in December). In February, we almost doubled that amount by having 47,000. In March, I am very proud to announce that the number of page views has surpassed 94,000 for the month. So for 3 consecutive months, the number of page views has doubled in each successive month. I want to thank everyone so much for such an amazing feat!!
Bob Sproull
Monday, March 31, 2014
Blog Posting Index through March 31, 2014......
Post # Subject Discussed
As promised, here is an updated posting index through March 31, 2014. Each of the following postings can be reached by
searching for the number designation below.
For example: 1 is Focus and
Leverage or 2 is Focus and Leverage Part 2 and so forth. The link to the first blog posting is: http://www.blogger.com/blogger.g?blogID=4654571158555106378#editor/target=post;postID=4464386559619829406
1. Introduction
to TOC – Lean – Six Sigma
2. Why
Improvement Initiatives Fail
3. The
Basic Concepts of TOC
4. Throughput
Accounting
5. The
Process of On-Going Improvement (POOGI)
6. The
3 Cycles of Improvement
7. Combining
TOC, Lean and Six Sigma Graphically
8. Step
1a Performance Metrics
9. Planning
Steps 1b and 1c Reducing Waste and Variation
10. Developing
a Constraint’s Improvement Plan
11. This
number was skipped
12. Steps
1b and 1c Reducing Waste and Variation plus an intro to DBR
13. Drum-Buffer-Rope
14. The
Final Steps of UIC
15. How
do I start the UIC?
16. The
10 Prerequisite Beliefs
17. Comparing
Lean, Six Sigma and TOC
18. Types
of Constraints
19. The
Logical Thinking Processes
20. Undesirable
Effects (UDE’s)
21. Categories
of Legitimate Reservation
22. Current
Reality Trees
23. Constructing
Current Reality Trees
24. Conflict
Diagrams Basic Principles
25. Constructing
Conflict Diagrams
26. Intro
to Future Reality Trees
27. Constructing
Future Reality Trees
28. Prerequisite
Trees
29. Constructing
Prerequisite Trees
30. Transition
Trees
31. Constructing
Transition Trees
32. Book
Announcement
33. Project
Management Failures
34. Project
Management Negative Behaviors
35. Critical
Path Management (CPM)
36. Critical
Chain Project Management (CCPM)
37. Tracking
Projects In CCPM
38. Final
Posting on CCPM
39. Intro
to the TOC Parts Replenishment Model versus the Min/Max System
40. The
TOC Parts Replenishment Model
41. Interview
with Joe Dager from Business901
42. Deming,
Ohno and Goldratt Commonality
43. Dedication to Dr.
Eliyahu Goldratt
44. How processing time, cycle time, throughput and WIP are
interrelated
45. Little’s Law
46. Batch and queue production system and the fallacy of a balanced
line
47. Why an unbalanced line is better.
48. What prevents me from making more money now and more money in
the future?
49. More on the 10 Prerequisite Beliefs
50. Motivating a work force to actively participate in improvement
initiatives
51. Re-Introducing the Intermediate Objectives Map
52. Introducing Be Fast or Be Gone: Racing the Clock
with CCPM
53. Parkinson’s Law, The Student Syndrome, Cherry Picking and
Multi-Tasking
54. Overcoming the four negative behaviors in Project Management
55. Intro to combining the Interference Diagram
(ID) and the IO Map
56. The Simplified Strategy
57. The Interference Diagram
58. Interference Diagram for Strategy
59. The ID/IO Simplified Strategy
60. Preface Part 1 for Epiphanized©
61. Preface Part 2 for Epiphanized©
62. CHAPTER 1 Part 1 for Epiphanized©
63. CHAPTER 1 Parts 2 and 3 for Epiphanized©
64. CHAPTER 1 Part 4 for Epiphanized©
65. CHAPTER 1 Part 5 for Epiphanized©
66. Focused Operations
Management For Health Service Organizations by Boaz Ronen, Joseph Pliskin and
Shimeon Pass
67. Marketplace Constraints
68. A Discussion on Variability
69. More Discussion on Variability
70. Still More Discussion on Variability
71. Paper from the International Journal of Integrated Care
72. Value Stream Mapping
73. Paths of Variation
74. Step 3, Subordination
75. The Key to Profitability: Making Money Versus Saving Money
76. My
First Experience With TOC
77. TOC in Non-Manufacturing Environments
78. Deborah Smith’s Excellent Chapter in the TOC Handbook (i.e.
Chapter 14)
79. More on Performance Metrics
80. Efficiency, Productivity, and Utilization (EPU) ©
81. Productivity
as a Performance Metric
82. Utilization
as a Performance Metric
83. What the Dog Saw –Malcolm Gladwell
84. Speaking
at the CPI Symposium – Cal State, Northridge
85. NOVACES–
A Great Young Company
86. NOVACES’SystemCPI©
87. Problems
With My Publisher
88. The
Why? – Why? Diagram
89. Experience
With the Integrated Methodology
90. A
New Piping Diagram
91. The
Healthcare Industry
92. More
Bad News From the Publisher
93. A
Message from the CPI Symposium
94. Multiple
Drum-Buffer-Rope
95. Problem
Solving Roadmap
96. Problem
Prevention Roadmap
97. Improving
Profitability
98. More
on Throughput Accounting
99. More
on Parts Replenishment
100. TLS
101. Engaging the "Money Makers" in Your Company
102. A Conversation on the Theory of Constraints
103. The Key to Successful Consulting Engagements
104. The Three Basic Questions to Answer
105. A Problem With the Airlines
106. A Better Way to Improve Processes and Systems
107. The Problem With Project Management
108. Critical Path Project Management Revisited
109. Critical Chain Project Management Revisited
110. The
Fever Chart
111. Comparing
CPM and CCPM
112. Performance
Improvement for Healthcare – Leading Change with Lean, Six Sigma and Constraints
Management
113. More on Performance
Improvement for Healthcare
114. Even more on Performance
Improvement for Healthcare
115. Still One More on Performance
Improvement for Healthcare
116. The Final One on Performance
Improvement for Healthcare
117. The Real Final One on Performance
Improvement for Healthcare
118. Focused Operation's
Management for Health Services Organizations.
119. Focused Management Methodology
120. The Clogged Drain
121. The “Soft” Tools of Improvement
122. More on TOC’s Distribution/Replenishment solution
123. Still
More on TOC’s Distribution/Replenishment solution
124. Amir Schragenheim’s Chapter 11 entry in the TOC Handbook
125. Comparison of Lean, Six Sigma and TOC
126. A Simple Lesson on Applying TLS to Your Processes
127. A Historical Index of Blog Postings
128. Mafia Offer Part 1
129. Mafia Offer Part 2
130. Mafia Offer Part 3
131. Airline Problems
132. A YouTube Interview with Bob Sproull and
Mike Hannan
133. Active Listening
134. Viable Vision
135. Throughput Accounting
136.
Performance Metrics
137.
On-the-Line Charting
138.
Comment on Epiphanized from a
reader in the US Marines
139.
Active Listening
140.
Healthcare Case Study
141. Change
142.
Getting buy-in for Change
143.
Aviation Maintenance, Repair and Overhaul Client Part 1
144. Aviation
Maintenance, Repair and Overhaul Client Part 2
145.
Continuous Improvement in Healthcare
146. Using
Your Senses in Continuous Improvement
147. A
Video by Phillip Marris on CI
148. An
article about a Construction Company Using the TOC Thinking Processes
149. Using
TOC in Healthcare Part 1
150. Using
TOC in Healthcare Part 2
151. Using
TOC in Healthcare Part 3 Supply Replenishment
152. Using
TOC in Healthcare Part 4 Supply Replenishment (con’t)
153. Using
TOC in Healthcare Part 5 Supply Replenishment (final)
154. The
Sock Maker
155. The
Negative Effects of Using Efficiency
156. Cost
Accounting Part 1
157. A
Political Voting Story
158. Cost
Accounting Part 2
159. Cost
Accounting Part 3
160. Using
TLS for the Affordable Care Act
161. The
System Constraint in Hospitals Part 1
162. Wait
Times in Hospitals
163. The
Oncology Clinic Case Study Part 1
164. The
Oncology Clinic Case Study Part 2
165. Article:
Emergency Department Throughput, Crowding, and Financial Outcomes for Hospitals
166.
Goldratt’s 5 Focusing Steps in Healthcare
167. My
First Experience With TOC Part 1
168. My
First Experience With TOC Part 2
169. My
First Experience With TOC Part 3
170. My
First Experience With TOC Part 4
171. My
First Experience With TOC Part 5
172. My
First Experience With TOC Part 6
173. Healthcare
Case Study Part 1
174.
Healthcare Case Study Part 2
175.
Healthcare Case Study Part 3
176. TOC
in Healthcare
177.
Healthcare Case Study Part 4
178. My
Transition From Aviation Maintenance to Healthcare
179. Door
to Doc Time Case Study Part 1
180. Door
to Doc Time Case Study Part 2
181. Door
to Doc Time Case Study Part 3
182. Door
to Doc Time Case Study Part 4
183. My
White Paper in Quality Forum Part 1
184. My
White Paper in Quality Forum Part 2
185. My
White Paper in Quality Forum Part 3
186. A
Meeting on Epiphanized at the
Pittsburgh Airport
187.
Billing for Immunizations Case Study Part 1
188. Some
Thoughts on Performance Improvement Part 1
189. Some
Thoughts on Performance Improvement Part 2
190. Case
Study on Using TOC in Healthcare
191. IO
Map
192. TOC
Thinking Process Tools Part 1
192B. TOC
Thinking Process Tools Part 2
193. Case
Study on How to Use TOC’s Thinking Processes Part 1
194. Case
Study on How to Use TOC’s Thinking Processes Part 2
195. Case
Study on How to Use TOC’s Thinking Processes Part 3
196.
Synchronized and Non-synchronized Production
197.
Competitive Edge Factors
198. Case
Study on How to Use TOC’s Thinking Processes Part 4
199. Case
Study on How to Use TOC’s Thinking Processes Part 5
200. Case Study
on How to Use TOC’s Thinking Processes Part 6
201. Case
Study on How to Use TOC’s Thinking Processes Part 7
202. Case
Study on How to Use TOC’s Thinking Processes Part 8
203. Case
Study on How to Use TOC’s Thinking Processes Part 9
204. Case
Study on How to Use TOC’s Thinking Processes Part 10
205. Case
Study on How to Use TOC’s Thinking Processes Part 11
206. Case
Study on How to Use TOC’s Thinking Processes Part 12
207. Case
Study on How to Use TOC’s Thinking Processes Part 13
208. Case
Study on How to Use TOC’s Thinking Processes Part 14
209. Case
Study on How to Use TOC’s Thinking Processes Part 15
210. Case
Study on How to Use TOC’s Thinking Processes Part 16
211. The
IO Map Revisited Part 1
212. The
IO Map Revisited Part 2
213. The IO
Map Revisited Part 3
214. The
IO Map Revisited Part 4
215. An
Interview About The Ultimate Improvement
Cycle by Joe Dager
216. Healthcare
Case Study: Door to Balloon Time Part 1
217. More
On My First Experience With TOC Part 1
218. More
On My First Experience With TOC Part 2
219. More
On My First Experience With TOC Part 3
220. More
On My First Experience With TOC Part 3
221. More
On My First Experience With TOC Part 4
222. A
Discussion on Constraints Management Part 1
223. A
Discussion on Constraints Management Part 2
224. A
Discussion on Constraints Management Part 3
225. A
Discussion on Constraints Management Part 4
226. A
Discussion on Constraints Management Part 6
227. How I
Present TOC Basics to Students & Teams Part 1 (Most viewed of all posts)
228. How I
Present TOC Basics to Students & Teams Part 2
229.
YouTube Video on Improving Flow Through a Bottleneck
230.
YouTube Video on Throughput Accounting
231.
YouTube Video on What to Change
232.
YouTube Video on What to Change To
233.
YouTube Video on How to Cause the Change to Happen
234. A
Meeting With an Executive of a Larger Corporation
235. The
Missing Link
236. You
Tube Video by Goldratt on Henry Ford and Taichi Ohno
237. Prevention
Versus Detection – The Bug Guy
238. An
Article by Anna Gorman of the LA Times
239. TOC’s Solution to Supply Chain Problems
240. The Nun
and the Bureaucrat Part 1
241. The Nun
and the Bureaucrat Part 2
242. The Nun
and the Bureaucrat Part 3
243. The Nun
and the Bureaucrat Part 4
244. The Nun
and the Bureaucrat Part 5
245. The Nun
and the Bureaucrat Part 6
246. A Healthcare Clinic Case Study Part 1
246B. An Update to Focus and Leverage Part 246
247, Drum Buffer Rope in Manufacturing
248. The Sock Maker Revisited Part 1
249. The Sock Maker Revisited Part 2
250. Throughput Accounting Part 1
251. Throughput Accounting Part 2
252. Throughput Accounting Part 3
253. How to Use and Integrated TOC, Lean & Six
Sigma Methodology Part 1
254. How to Use and Integrated TOC, Lean & Six
Sigma Methodology Part 2
255. How to Use and Integrated TOC, Lean & Six
Sigma Methodology Part 3
256. How to Use and Integrated TOC, Lean & Six
Sigma Methodology Part 4
257. How to Use and Integrated TOC, Lean & Six
Sigma Methodology Part 5
258. Critical Path Project Management Versus
Critical Chain PM Part 1
259. Critical Path Project Management Versus
Critical Chain PM Part 2
260. Critical Path Project Management Versus
Critical Chain PM Part 3
261. Critical Path Project Management Versus
Critical Chain PM Part 4
262. Critical Path Project Management Versus
Critical Chain PM Part 5
263. Critical Path Project Management Versus
Critical Chain PM Part 6
264. The Cabinet Maker – A TOC Case Study Part 1
265. The Cabinet Maker – A TOC Case Study Part 2
266. The Cabinet Maker – A TOC Case Study Part 3
267. The Cabinet Maker – A TOC Case Study Part 4
268. How I Run Improvement Events
269. Using The Goal Tree vs. the Full Thinking
Process Analysis Part 1
270. Using The Goal Tree vs. the Full Thinking
Process Analysis Part 2
271. Using The Goal Tree vs. the Full Thinking
Process Analysis Part 3
272. Using The Goal Tree vs. the Full Thinking
Process Analysis Part 4
273. Using The Goal Tree vs. the Full Thinking
Process Analysis Part 5
274. Using The Goal Tree vs. the Full Thinking
Process Analysis Part 6
275. An Analysis of Focus and Leverage’s Top Page
View Postings
276. An Index of All Focus and Leverage Blog Posts
277. Using the Thinking Processes in Healthcare
Part 1
278. Using the Thinking Processes in Healthcare
Part 2
279. Using the Thinking Processes in Healthcare
Part 3
280. The Four Disciplines of Execution Part 1
281. The Four Disciplines of Execution Part 2
282. The Four Disciplines of Execution Part 3
283. The Four Disciplines of Execution Part 4
284. The Four Disciplines of Execution Part 5
285. The Goal Tree – A New Way to Make it and Use
It Part 1
286. The Goal Tree – A New Way to Make it and Use
It Part 2
287. The Goal Tree – A New Way to Make it and Use
It Part 3
288. Operation Excellence by Jim Covington
289. The Saw Mill Assessment
290. How I present the Theory of Constraints to
People Not Familiar With it
291. David and Goliath – Malcolm Gladwell’s Latest
Book
292. The Basics of TOC
293. TOC’s Replenishment Model Part 1
294. TOC’s Replenishment Model Part 2
295. Blog Posting Index
296. Overcoming Natural Resistance to Change
297. Integrating TOC, Lean and Six Sigma Part 1
298. Appendix 1 from Epiphanized Part 1
299. The Winter Storm in Atlanta
300. Appendix 1 from Epiphanized Part 2
301. Appendix 1 from Epiphanized Part 3
302. Appendix 1 from Epiphanized Part 4 Final
303. Bill Dettmer videos on TOC’s Thinking
Processes
304. Queuing Theory Part 1
305. Queuing Theory Part 2
306. Delta Airlines Lack of Customer Focus
307. Bill Dettmer’s Book Strategic Navigation
308. Excerpts from The Ultimate Improvement Cycle – My second book Part 1
309. Excerpts from The Ultimate Improvement Cycle – My second book Part 2
310. Excerpts from The Ultimate Improvement Cycle – My second book Part 3
311. Excerpts from The Ultimate Improvement Cycle – My second book Part 4
312. Excerpts from The Ultimate Improvement Cycle – My second book Part 5
313. The
Ultimate Improvement Cycle – Step 1:
Identify - My second book Part 6
314. The
Ultimate Improvement Cycle – Step 2:
Define, Measure and Analyze - My second book Part 7
315. The
Ultimate Improvement Cycle – Step 3:
Improve - My second book Part 8
316. The
Ultimate Improvement Cycle – Step 3:
Control - My second book Part 9
317. Throughput Accounting Part 1
318. Throughput Accounting Part 2
319. Throughput Accounting Part 3
320. Throughput Accounting Part 4
321. Throughput Accounting Part 5
322. Throughput Accounting Part 6
323. Throughput Accounting Part 7 Final
324. Optimium Health’s Amazing New Software for
Healthcare
325. Personal experiences using Throughput
Accounting
326. MRO Project Management Case Study Part 1
327. MRO Project Management Case Study Part 2
328. MRO Project Management Case Study Part 3
329. MRO Project Management Case Study Part 4
330. MRO Project Management Case Study Part 5
Focus and Leverage Part 330
In this posting we’ll take a look
at the stark differences between CCPM and CPM and why I believe that CCPM is
the superior method. If you have any comments or questions, please leave them in the comments section of this blog and I will respond to them.
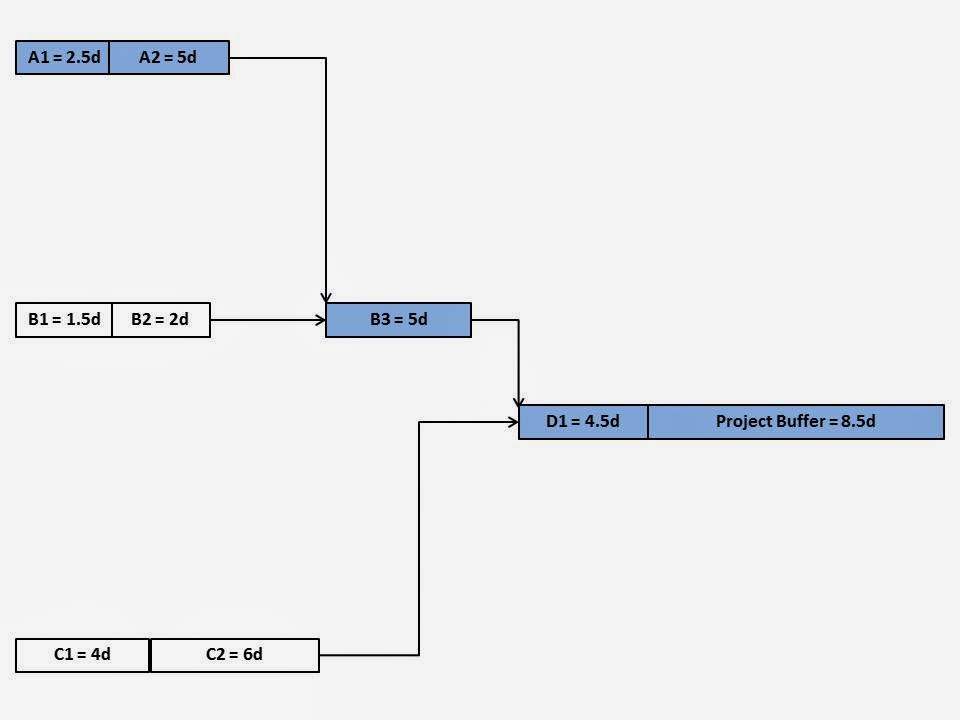
In CPM, tasks are over-inflated by at least 50 percent and here’s where we take advantage of this extra time. We now subtract half of the time estimates from each one of the tasks and create a project buffer as in the following figure.
In CPM, tasks are over-inflated by at least 50 percent and here’s where we take advantage of this extra time. We now subtract half of the time estimates from each one of the tasks and create a project buffer as in the following figure.

As you can see, the new
tasks times are half of the original estimates, but you can also see that we
now have added a project buffer. The
project buffer becomes half of the time we have taken from the task
durations. The next question we now posed to leadership
was, how does having this project buffer improve the on-time completion of projects? Surprisingly, one member of the leadership
team was able to give a wonderful analogy to answer this question. The team member said, “If I understand this
concept, then the project buffer works just like a bank account with deposits
and withdrawals. If a task takes longer
than the estimate, you withdraw time from the project buffer, but if the task
is finished in a shorter amount of time, you add the time back into the project
buffer. We told him this was a great
analogy.
With CPM, delays are
passed on while gains are lost and this is such a significant difference! The project buffer protects the project from
delays. We also explained that we also
add feeding buffers to make sure that tasks not on the critical chain are
completed on time.
At this point there was a
question from the leadership team on why we thought that having this project
buffer would eliminate the Student Syndrome and Parkinson’s Law and we answered
this question in the following way. In
traditional project management, that is using the Critical Path Method (CPM),
each task has a scheduled start and finish date. CCPM completely removes the start and finish
dates from the schedule so that the focus will be passing on tasks as soon as they
are completed. In doing so, both the Student Syndrome and Parkinson’s Law are
pretty much neutralized. We explained that CCPM uses a relay race mentality
whereby the runner completes a certain distance and then passes off the baton
to the next runner who is waiting.
Earlier I explained that in CPM
we track progress of the project by calculating the percentage of individual
tasks completed and then comparing that percentage against the project due date.
The problem with this method is that it
is nearly impossible to know how much time is remaining to complete the project.
If you use this method to track
progress, many times you’ll see 90 percent of a project completed only to see
the remaining 10 percent take just as long. In fact, looking at the number or
percentage of tasks completed, instead of how much of the critical path has
been completed, only really serves to give a false sense of schedule conformance. CCPM measures project performance in a much
different way, and in so doing, allows the project to make valuable use of
early finishes of tasks. CCPM uses something called a Fever Chart, which is
simply a run chart of the percentage of the critical chain completed versus the
percentage of project buffer consumed. In the figure below, you’ll see three different
colored zones. We explained the
different colors as follows: Green means
that the project is progressing either on or ahead of schedule; yellow means
that the project is using more buffer than progress is being made and that it’s
time to develop a plan to reduce the rate of buffer consumption. Red means that buffer is being used at an
alarming rate and that if no action is taken, the project will definitely be
late.

In order to reinforce the
interpretation of this color scheme, we then asked the leadership team if it
was ever acceptable for your project to finish the project in the red on the
fever chart and virtually everyone said no, except for one person. We then asked, this person to explain under
what circumstances that it would that be acceptable.
The response was that ss long as
the critical chain is 100 percent completed, and you haven’t used more than 100
percent of your project buffer, then finishing in the red is perfectly
acceptable. We agreed and told them that
in fact, if both of these variables are at the 100 percent level, the project
is exactly on time.
It was very important that
the leadership team understood how to interpret the fever chart, so we then
asked for a volunteer to explain what they saw on this fever chart. Some did volunteer and explained it very
well. Tis project started off ahead of
schedule by completing 20 percent of the critical chain while only consuming 8
percent of the buffer. But if you look at the latest data point, only 41
percent of the chain is complete, but 72 percent of the buffer has been consumed,
This project is now behind schedule, and unless some kind of intervention is
undertaken, this project will be late.
It doesn’t mean that this project is doomed to be late, but rather it
only means that some kind of action must be taken, or the project will be late
completing.
The key point to remember
here is that you should get excited with vertical rises because it always
spells trouble if left unattended, In
addition, we explained that if you divide the percent of the critical chain
completed into the percent of buffer consumed, this ratio could give a single
number that would tell you how well you’re doing. So if your ratio was above one, your rate of
buffer consumption would be too high, while if the ratio is below one, everything
is going well. This was important for
the leadership to understand because they would not have to review every fever
chart for every project. They could
simply look at the ratio for each project and know if it was on schedule or whether
it might need their help.

One other point we presented to the
leadership team was the concept of a portfolio of projects. We presented the fever chart above to let
them know that this was a tool that would allow them to see, at a glance, which
projects might need their attention. On
a single sheet of paper or one computer screen, they would be able to see which
projects were red and yellow….those that might need their attention and which
projects that they could ignore (i.e. the green ones). In the above fever chart we asked them which
ones might be in need of an intervention and they all rightfully told us that
projects 1 and 7 were clearly eating up buffer at an unacceptable rate and that
projects 2, 3 and possible 8, might need some work. They also recognized that projects 4, 5, 6
and 9 did not pose a threat, at least for the moment.
There was another side of
the CCPM implementation that we explained to the leadership team, key things
that must be done if their CCPM implementation was going to be successful. We
explained that every day there must be stand-up meetings with the key resources
to find out what their resources might need.. By that we meant that they should
go to the resources and ask them if they have everything they need and if they
have any problems. The leadership team needed to understand that if the “boots
on the ground” executing the projects couldn’t resolve their issues, then they
must escalate the problem up through the various levels of management. We explained that although this may sound
trivial, it truly isn’t and that if this step is not taken seriously, the
implementation will never be sustained.
In my next posting, we’ll take a look at the
results achieved as a result of this implementation.
Bob Sproull
Saturday, March 29, 2014
Focus and Leverage Part 329
In this posting, I’m going
to discuss how we explained a new form of Project Management known as Critical
Chain Project Management (CCPM) and how we were able to differentiate it from
the Critical Path Method (CPM). We’ll
also discuss how the results of this new method significantly impacted the
completion rates of projects and delve into the financial impact of this
implementation.
As a refresher, we said
that CPM task durations are inflated to protect against Murphy, but what if
there was a way to significantly reduce these imbedded safety buffers and
still be able to provide the protection from Murphy that we need? Using my example from Part 328, suppose we
were able to reduce the estimated duration by as much as 50 fifty percent and
still protect against Murphy. Does that sound like a significant
reduction? You may be thinking that, if
this contractor was already late on projects with all of this built-in safety,
how in the world would reducing these durations result in better project on-time
completion rates? What I’m proposing is
that on my example from Part 328, we said that we had three projects each with
an estimated duration of nine days. Referring to the drawing below, using CCPM,
I’m suggesting that each project will now take only four and a half days and
the total time to complete all three projects would theoretically be thirteen
and a half days.

It was a daunting task to
convince this contractor’s leadership that we could reduce their imbedded
safety by a factor of 50 percent and still safely guard against the uncertainty
introduced by Murphy. In order to
convince the contractor that this was indeed possible, I found it necessary to refresh
their minds a bit on the Theory of Constraints. Specifically, I presented the piping diagram
and the simple four-step process that I presented to them during their initial
training on TOC. For you first timers to
my blog, the figures below are what I am referring to here.
Our CI Team asked the leadership
team to tell us what was the key to improving throughput in both of those
drawings and they correctly stated that they would have to identify the
constraint and then exploit it. We also
asked them to tell us how they would prevent a WIP explosion in the process,
and they correctly told us that it would be necessary to subordinate everything
else to the constraint. We then asked
them whether or not reducing cycle times at non-constraints was a fruitless
exercise to which they told us that they should only focus on the system constraint
and that it should never be idle. This was very important for them to
understand because of how CCPM works. In
other words, we wanted the existence of a constraint to be foremost in their
minds as we moved on.


Next, we asked leadership to tell us what the
constraint was in their maintenance projects.
After careful deliberation, only one person raised their hand and explained
that in a project, it’s not the longest task necessarily that is the
constraint, but it’s probably the longest set of sequential tasks, where one
task is dependent upon another and that this series of interconnected tasks
is probably the constraint. This was a
correct answer, so we explained that this series of dependent tasks is actually
referred to as the critical path which in CPM is, in fact, the constraint. We needed them to understand this concept so
that when we presented the concept of CCPM, they would see that it too is the
constraint, but that it’s very different than CPM’s Critical Path.
In Focus and Leverage Part 328, I presented
two behaviors known as the Student Syndrome and Parkinson’s Law and how both of these behaviors work to extend the time required to
complete a project. I explained that with
CPM, planning resources estimate individual task times and then add in their
own protection against disruptions caused primarily by Murphy. And then the
effects of Parkinson’s and the Student Syndrome waste most of the safety that
has been added. So the question our implementation
team had to explain was, how does CCPM deal with these behaviors?
We explained that while CPM
relies on individual task durations as well as scheduled start and finish
dates, CCPM does not. The project focus
is no longer on finishing individual tasks on time, but rather completing tasks
as soon as possible. Like CPM, CCPM
still gathers estimates on individual tasks and identifies its own version of
the critical path that is referred to as the Critical Chain. However, unlike
CPM, CCPM also considers the competing resources and includes them as part of
the critical chain. We then presented an example of this new way of looking at
projects as depicted in the following figure.

As I explained earlier,
CPM defines the critical path as the longest path of dependent tasks within a
project. That is, tasks are dependent when the completion of one task isn’t
possible until the completion of a preceding task. Any delay on the critical path will delay the
project correspondingly. In this figure,
the critical path is highlighted according to the CPM method. It’s important to remember that CPM
determines the critical path by looking at the task dependencies within the project. So using CPM, the critical path would be
C1-C2-D1, and the project completion estimate would be the sum of those days,
or twenty-nine days. We wanted to draw a
distinction between CPM and CCPM, so it was important for the contractor’s
leadership to understand their existing methodology.
One of the shortcomings of CPM is
the failure to consider or recognize the existence of resource dependencies, so
what if, in our example in the above figure, tasks A2 and B3 are performed by
the same resource? Would the critical path be different? Since A2 and B3 are done by the same
resource, they can’t both be done at the same time. Because of this dependency,
we have to move B3 to begin after the same resource completed A2. So the new critical path would be A1-A2-B3-D1
and the new project estimate increases from the original twenty-nine days to
thirty-four days as seen in the figure below.
So the question now
becomes, what does the recognition of resource dependencies do to the on-time
completion of this project? It means
that without considering resource dependencies, using CPM, the project is
guaranteed to be late! This simple
consequence of incorrectly identifying the critical path—which we now refer to
as the critical chain—is that the project team will never be able to complete
their project on time without heroic efforts, adding additional resources,
overtime or a combination of all three. In presenting these project drawings,
it was now evident to the contractors leadership that the practical implication
of incorrectly identifying the real critical chain is that the focus will be on
the wrong tasks which is really no different than focusing on non-constraints
in a production process, right? This
explanation made it easy to see why the contractor’s projects are late so
often.
One of the leaders then
said that "There seems to be a problem that when we add resource dependencies to
the project, it will actually lengthen the project completion time, and that’s
not what we want…..we want to shorten them."
We then asked leadership what they thought we had to do to shorten the project
time? None of them had an answer. Remember earlier how we said that excessive
safety is imbedded within each task as a way to guard against the uncertainties
of Murphy? CCPM takes a completely
different approach by assuming that Murphy’s uncertainty will happen in every
project and unlike CPM, CCPM actually removes these safeties within each task
and pools them at the end of the project to protect the only date that really
matters, the project completion date. In
other words, instead of protecting the task due dates, we shift our thinking to
protecting the project due date and there is a significant difference.
In my next posting we'll dive deep into Critical Chain Project Management (CCPM) and discuss why it is so superior to the Critical Path Method (CPM).
Bob Sproull
Subscribe to:
Posts (Atom)